Feature Preview: Profiler
Welcome to the first Flax Facts in 2018! I’m very excited to show you our the latest engine feature: profiling tools set. Although Flax is running pretty good and has a great performance it’s important to keep eye on draw/update time charts and deliver games that run stable and smooth. So that’s why we’ve added a profiler!

Profiler Window
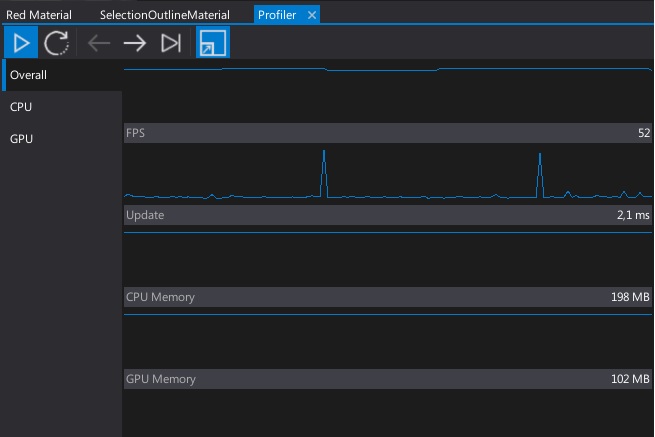
As you can see in the above picture the profiler window contains 3 major tabs: Overall, CPU, and GPU.
Each is dedicated to the specified profiling mode.
The first one contains several charts with major engine stats just to give general look at the performance.
It can be used to monitor frames per second, memory usage as well as game update time.

Overall profiler mode charts
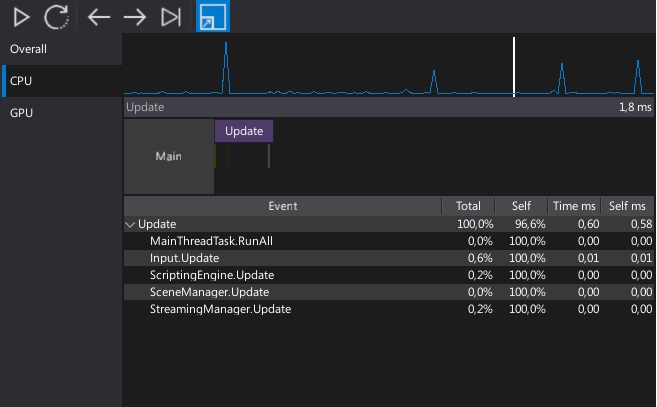
Next tab focuses on profiling CPU performance. It shows update time chart (in milliseconds) and recorded events timeline with detailed events table.
Profiler window allows previewing current frame live or select one of the recorded frames as shown in the picture below.
Also, CPU events are recorded per thread which means that profiling highly multithreaded games is very easy.

CPU profiler mode
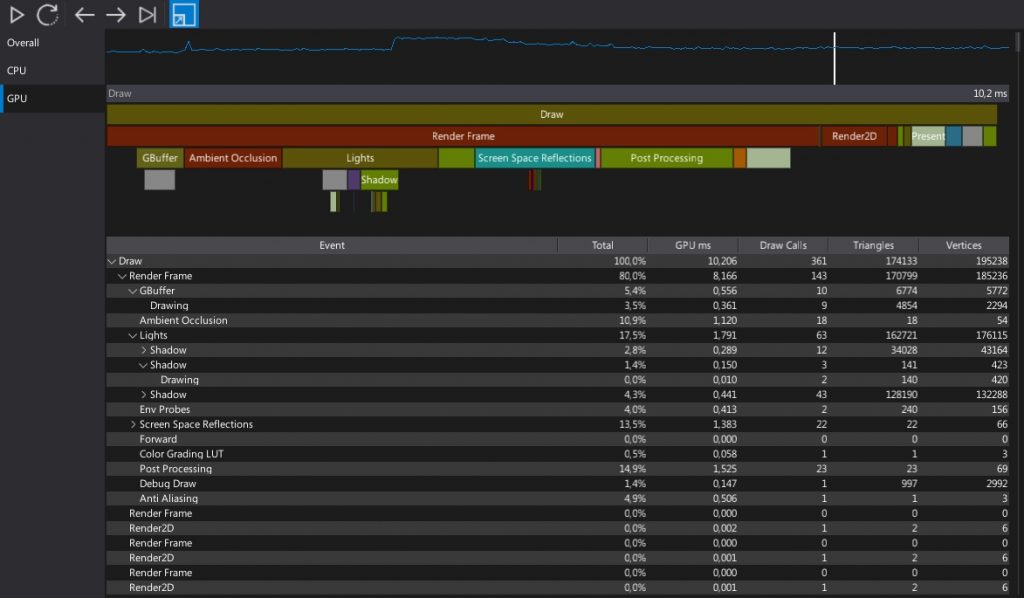
The last tab shows GPU performance monitoring.
It’s very similar to the CPU tab but instead of showing CPU timings it uses timer queries that run on a GPU to extract exact execution time of the rendering events.
Again it’s very helpful tool to debug and investigate game performance issues especially because it’s inbuilt into the engine so devs don’t need to use external tools like RenderDoc or similar.
As you can see in a below image, each event records also draw calls count and triangles/vertices rendered within.

GPU profiler mode
Future of profiler
I have to admit that using existing profiler helps with debugging performance issues of the complex scenes and makes game development a lot easier.
In fact it quite production-ready tool! However, it’s not the end. I think there are some more improvements that could be added. For example, events table rows could be sorted by the column. Or it could record exact stack traces for the C# scripts so debugging game logic would be easier. Also, there is lack of more detailed memory allocations debugger.
All in all, I’m pretty happy about this feature. As soon as alpha/beta will be released you’ll be able to test it by yourself. But that’s all for now.
See you soon! 🙂


0 Comments